

Commodities and curves: The influence of copper prices on Chile’s yield curve and its implications for investors
Pranav Srinivas | John Morozov


Source: Minera Escondida: A Copper Mine for SPACEBEL
Introduction
Chile has demonstrated substantial economic stability in the Latin American region, mainly due to its abundant copper reserves. Copper’s conductivity enables it to be applied across sectors which include: electronics, construction, transportation etc. Given its industry significance, copper plays a vital role in measuring the health of an economy. I contend that copper price cycles do not have a direct influence on Chile’s yield curve - however, based on my bullish outlook for the yield curve in 2026, investors should put on a steepener to profit from the rising spread, but they should be cautious of rising oil prices in the ongoing Middle Eastern Conflict, which could offset any profits from the steepener strategy.
The difference between the 10-year and 2-year government bonds - the yield curve spread, is a key economic indicator representing investor confidence on growth expectations.
The world is in a precarious state, plunged by conflicts with economic ramifications. In view of the ongoing uncertainty, two phases - the 2008 Global Financial Crisis (GFC), and COVID will be discussed. This will inform how copper prices influence Chile’s yield curve spread in these ‘stress test’ periods and serve as an anchor to examine the trajectory of Chile’s yield curve spread forecast for 2026 based on copper futures.
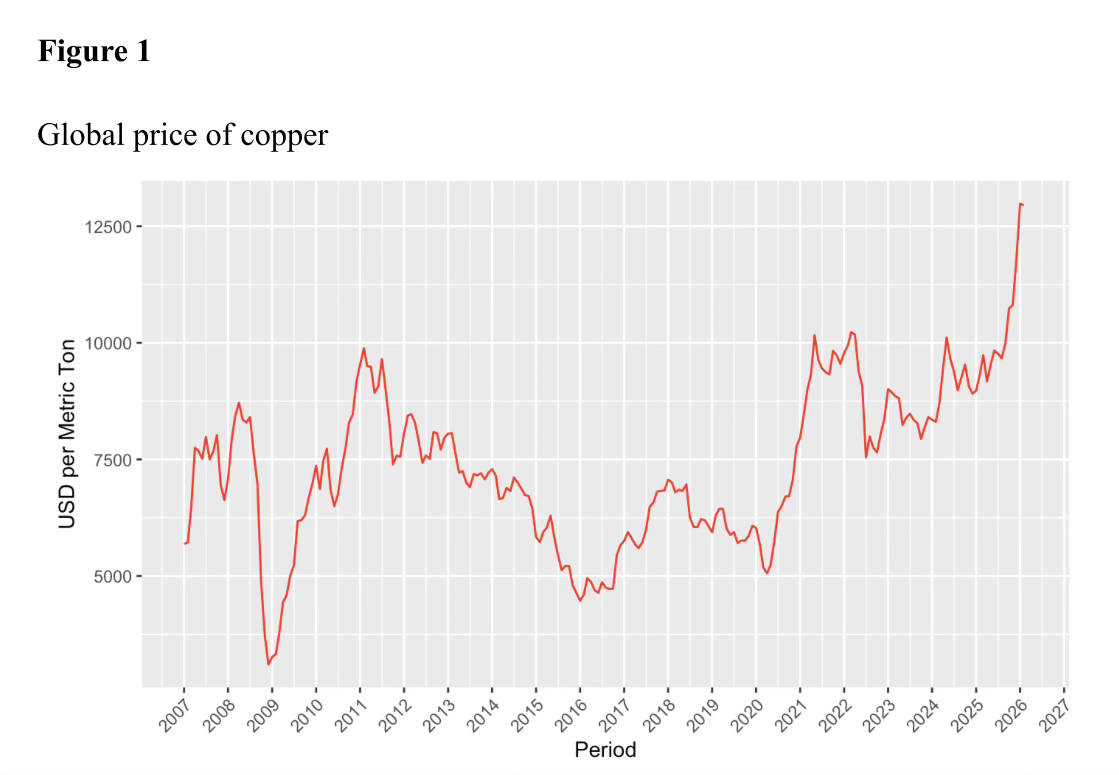
Source: Global Price of Copper (PCOPPUSDM)
Note: Copper prices overall rose in the past two decades - it experienced a huge downturn during GFC (drop in global demand), while it plummeted and rose during COVID (volatile demand from China, the largest importer of copper) and escalated in mid-2025 (heavy investment in AI centers which are driven by copper and supply shocks).
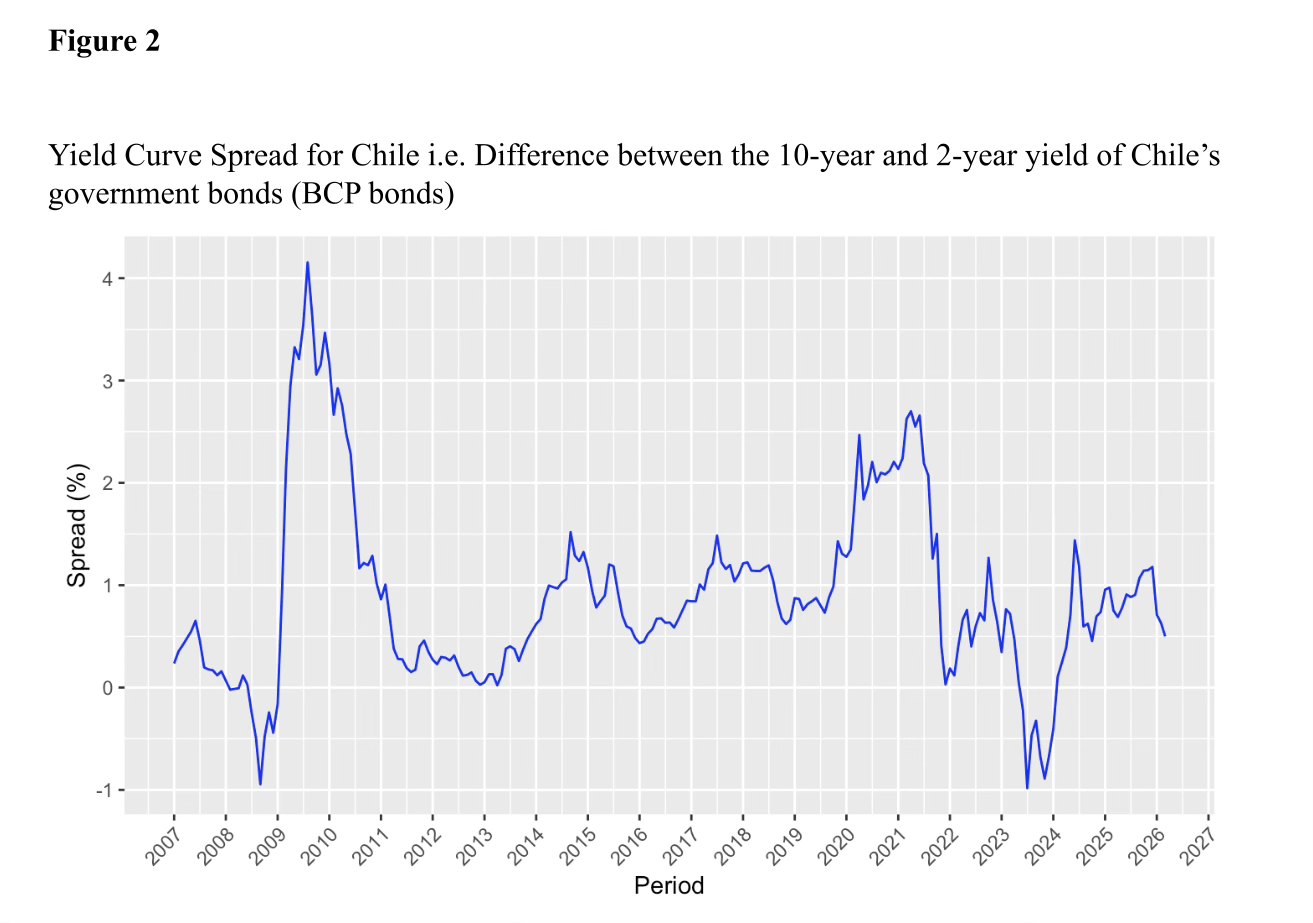
Source: CBoC (Banco Central de Chile)
Note: The spread dropped during GFC due to bearish growth expectations, reflecting a plummet in Chile’s 10-year yield, then rebounded close to 2009, much like the copper prices. On the other hand, the spread rose during the 2020 COVID phase due to relentless slashing of rates by CBoC to boost the economy, resulting in a lower 2-year yield.
Regression Analysis
A commodity-driven economy like Chile utilizes its revenues from higher copper prices as a shock absorber during financially stressful periods. During GFC, the housing market was adversely affected and copper prices plummeted from lack of demand.
Poor financial conditions meant lenders stopped providing short-term loans to Chile and domestic confidence shrunk along with a 23% decline in the CLP. The CBoC responded by sharply cutting interest rates to stimulate economic growth. For my analysis, I conducted statistical modeling where I regressed Chile’s yield curve spread on changes in: copper prices and the CLP exchange rate (against USD), since the latter reflects global sentiment and moves in tandem with copper prices.
As copper prices rise, Chile’s exports generate more revenue. This increases the price of CLP relative to other currencies, leading to its appreciation. It translates into two phenomena simultaneously: the longer end of the yield curve rising due to inflationary expectations in the long-run fuelled by growth, and the shorter end of the yield curve remaining low due to a stronger CLP, steepening the yield curve.
During GFC, a 1% rise in copper prices is associated with a 1.15 bps (0.0115%) rise in Chile’s yield curve spread, ceteris paribus. This suggests Chile’s yield curve becomes steeper and reflects stronger growth expectations for the nation.
COVID witnessed a 1% rise in copper prices being associated with a 1.63 bps (0.0163%) rise in Chile’s yield curve spread, ceteris paribus, having similar implications as GFC. This ties to prices rising because of: reviving demand from China and supply shortages due to mine closures in Peru (second largest producer of copper) - nonetheless, copper supply in Chile hasn’t been as adversely impacted due to mines maintaining their regular operations alongside a relatively less stricter approach towards quarantines and movement restrictions.
However, copper prices do not have a statistically significant impact on Chile’s yield curve in both phases, indicating that copper prices impact the yield curve through the CLP since these factors are strongly positively correlated.
Forecast & Trade Strategy
This analysis is conducted using the coefficient of the copper prices from the regression on the entire dataset. Combining this coefficient with copper futures for 2026 produces Chile’s implied yield curve spread for the rest of 2026. Copper futures are contracts that enable traders to transact copper at a predetermined price on a specific future date. The CLP was excluded here given the high volatility of exchange rates which would be hard to incorporate in a model.
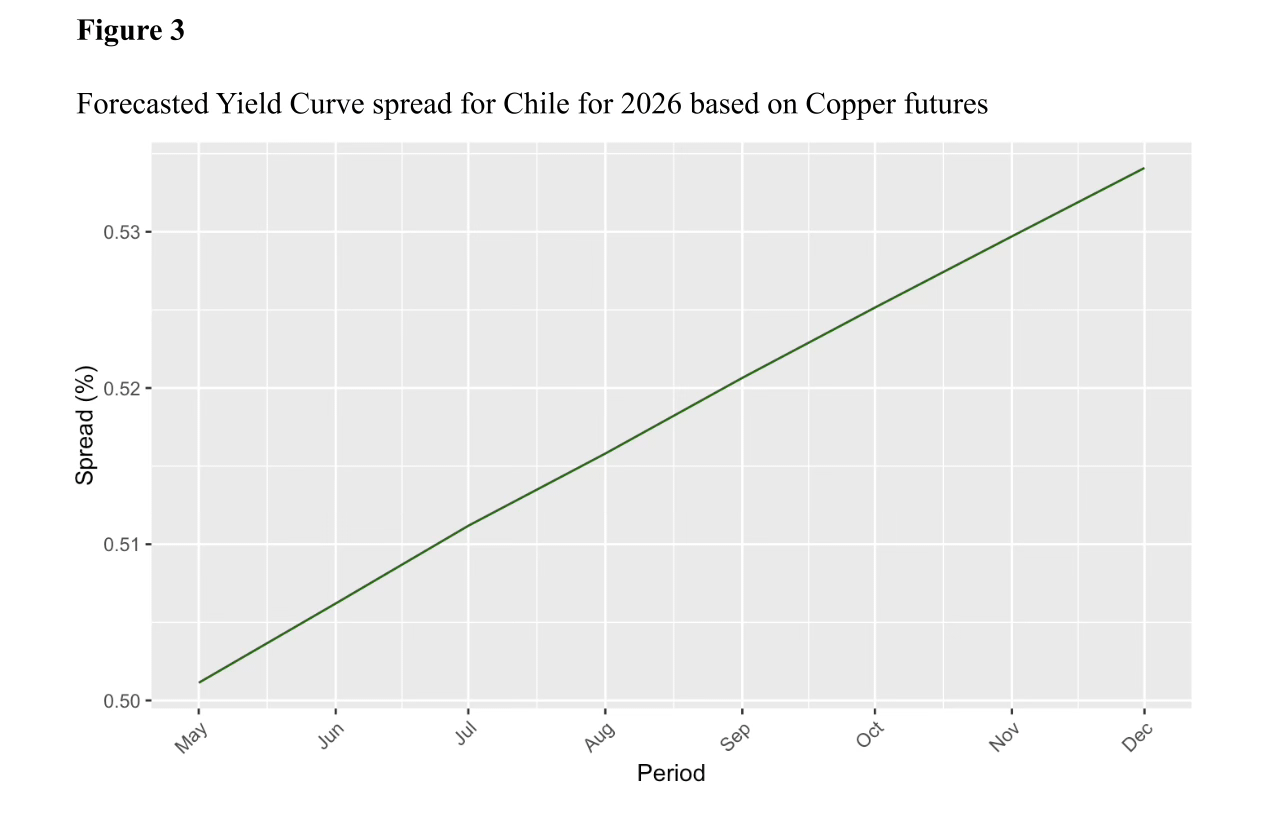
Source: CME Copper Futures - Settlements
Figure 3 shows the spread rising, which can be attributed to various reasons. The first one being that inflation has reached its 3% target, which would prompt the CBoC to lower rates, translating into a relatively low 2-year yield. Next, in early 2026, copper prices skyrocketed due to a combination of factors such as growth in AI and EVs which warrants a higher demand for copper due to its use in tech infrastructure. Also there has been a supply deficit in copper production which will contribute to higher projections of copper prices. This reflects a rise in long-term yields and consequently, greater growth expectations for Chile. The spread direction aligns with the prior periods.
Additionally, the policies of the newly elected president José Antonio Kast emphasize spending cuts to rein in the fiscal deficit (which will be challenging considering the spending pressures on social programs like education, reforms etc.) and his goals to minimize bottlenecks like red-tapism in copper mining. He also intends to reduce corporate taxes from 27% to 23% and enforce greater deregulation to bolster productivity and investment.
Based on the rising yield curve spread for Chile for 2026 alongside Kast’s expansionary policies, I recommend investors undertake a yield curve steepener. The curve will continue steepening as per my analysis. Additionally, the bullish view on copper prices and Chile’s economic growth would elevate its 10-year rate, alongside the 2-year rate being low (in alignment with CBoC’s dovish rate outlooks) - hence investors can purchase the 2-year bond and sell the 10-year bond to profit from the increasing spread.
One potential risk to this strategy is the possibility of CBoC hiking rates if oil prices remain elevated, given the ongoing Middle Eastern conflict. This will raise the 2-year rate which could flatten the yield curve and offset any profits made if the yield curve steepener strategy is undertaken.
Conclusion
During GFC and COVID, the movement in copper prices was associated with a statistically insignificant rise in Chile’s yield curve, and one explanation is that copper prices indirectly shape the yield curve through the CLP, since these factors have a strong correlation. One way to take this forward is improving the regression model to include factors like: growth, interest rates, and global factors which would likely have a pronounced effect on the spread and can inform more robust interpretations.
The forecasted rising yield curve spread based on domestic policies and rising copper prices makes the yield curve steepener an attractive trade. Nevertheless, investors must exercise judgment in their fixed income trades given ongoing conflicts. It remains to be seen how the yield curve is shaped not only by the local regime but also worldwide events in this highly uncertain period.

Pranav Srinivas is a first year in the MA in Statistics program, concentrating in Risk & Financial Modeling (GSAS ’26). His interests lie at the intersection of statistics and macro, especially fixed income & FX. A cinephile, he spends his free time watching films across genres and languages. He is also an avid squash player and represented his undergrad college, Carnegie Mellon, at the club national level.
 | A guest post by
|